
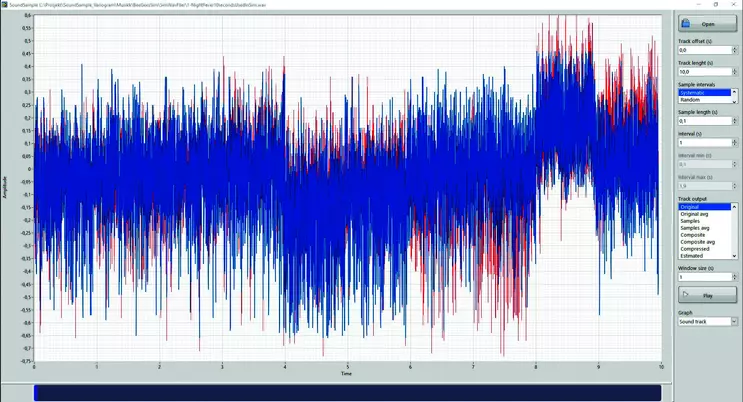
Simulation (right) of ten seconds of "Night Fever" by the Bee Gees. While it is not possible to recognize the song, the simulation recreated the histogram and the variogram of the reality. [Graphs here and on the next two pages courtesy of the authors; screen shot of the Bee Gees (above) derived from the official video for "Night Fever"]
M3G: Music as a Metaphor in Mining Geostatistics
STEINAR LØVE ELLEFMO (steinar.ellefmo@ntnu.no) and TORKJELL BREIVIK (torkjell.breivik@ntnu.no) are affi liated with the Department of Geoscience and Petroleum at Norwegian University of Science and Technology, Trondheim, Norway, where Ellefmo is an associate professor and Breivik is chief engineer. MICAH NEHRING (m.nehring@uq.edu.au) and JULIE BALLANTYNE (j.ballantyne@uq.edu.au) are affi liated with University of Queensland, Brisbane, Australia, where Nehring is a lecturer in the School of Mechanical and Mining Engineering and Ballantyne is an associate professor in the School of Music.
Our society needs mining. Mined minerals and metals are constituents in everything from toothpaste, computers, and cars to mobile phones and wine bottles. The work towards replacing petroleum-based energy production with renewable energy and e-mobility requires significant amounts of metals such as copper, nickel, cobalt and rare earth elements. Mining is a complex engineering endeavor where one must handle uncertainties linked to social, legal, ecological, technical and geological factors. To quantify environmental or geological uncertainties and the associated risks, geologists and mining engineers use geostatistics. Estimating and assessing value of "grade in the ground" is fundamental to any mining project. Teaching mining engineering students how to use geostatistics to understand the viability of a potential mine is therefore important.
Geostatistics is about describing and using the concept of the regionalized variable to predict, based on sampled material, the value at unsampled locations (Chilès and Delfiner 2012). The regionalized variable is conceptually the sum of three aspects (Matheron 1963). These three are: a structured aspect, or the "drift," representing how the geologic "landscape" changes on large scale; a spatially correlated random aspect; and a spatially uncorrelated random aspect. The random aspects represent how the geological landscape changes on small scales. The spatial correlation is modeled using the variogram, which is a description of how the variable varies spatially. The samples that we have collected and analyzed for metals or minerals are conceptually considered to be realizations of the regionalized variable. The variogram helps us find the best possible estimate.
Geostatistics is typically taught at universities using traditional pedagogies (lectures and tutorials). Geological data are used to calculate summary statistics, make plots, show example estimations, derive and use estimation equations, etc. Concepts such as the regionalized variable are explained orally with illustrations and supplemented with in-class discussions. Regionalized variable theory says that estimation of metal or mineral content between sample locations should take into account the spatial variability quantified by, for example, the variogram.
A New Way to Conceptualize Geostatistics
In typical course experiences, students are asked to investigate datasets, estimate the variogram and fit variogram models, and make estimations using a small subset of estimation techniques available. This project instead uses music as a metaphor to help them understand the concept of the regionalized variables in geostatistics and to visualize how good geostatistical approaches are at estimating the reality.
The traditional approach to teaching geostatistics is limited: students struggle to truly understand fundamental concepts and the implications of sampling techniques and how these relate to the "grade in the ground." Music as a Metaphor in Mining Geostatistics: M3G is designed to allow students to experience interactively the effect of different sampling techniques. In this metaphorical exploration of geostatistics, instead of using geological data, the students can explore key concepts through hearing the impact of particular sampling techniques on the overall "sound" of the sample. This engages a constructivist approach to learning whereby students' understanding of the topic is enhanced by interaction with the program and with each other within a group setting.
Music can be characterized by its dimensions, rhythm, brightness, melody, pitch, and timbre. Similarly, ore deposits containing minerals and metals can be characterized by ore grade (e.g., percentage of copper), strength, and hardness and on how coarse- or fine-grained the minerals are.
A piece of music can be illustrated by a wave graph where the amplitude is plotted as a function of time. This wave graph can be viewed as "a regionalized variable" describing the song.
Figure 1 shows the wave graphs of 10 seconds of the song "Dance Monkey" by Tones and I; Figure 2 shows 10 seconds of the "Flight of the Bumblebee" by Nikolai Rimsky-Korsakov. The wave graphs show that the music pieces are very different. The idea is that one can play the music to hear and describe the differences. The identification and understanding of differences are triggered both by the auditory and the visual systems. The use of this multimodal perception to increase understanding of geostatistics is motivated by the McGurk effect (McGurk and MacDonald 1976) which documents that the eyes are imperative in understanding oral communication.

![[creative commons]](/images/creativecommons_16.png)


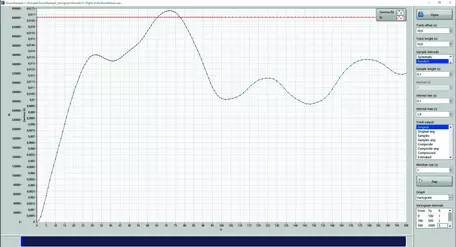
Another way to increase the understanding of the differences between the songs is to calculate the variogram, just like it is done in geostatistics (Figure 3 and Figure 4). There are basically three important parameters when geostatisticians describe and fit a model to a variogram. One is the so-called "nugget," which is the variogram value at zero distance. Then there is the "sill," the value on the y-axis where the graph flattens out (basically the overall variability of the music/ mineral content). Finally there is the "range," the value on the x-axis where the graph flattens out (the distance beyond which the music/ mineral content no longer shows any similarity (correlation).
"Dance Monkey" has a relatively short range equal to about 15 sample points that represents slightly more than 0.3 milliseconds. "The Flight of the Bumblebee" has a range of about 30, representing about 0.7 milliseconds. This means that there is a longer spatial correlation between amplitude points in "Flight of the Bumblebee" compared to "Dance Monkey."
The sills are also different, with "Dance Monkey" having a significantly higher sill. This is apparent in the wave graphs, which show that "Dance Monkey" has higher amplitudes than "Flight of the Bumblebee." This can probably be related to the obvious differences in instrumentation in the pop genre compared to classical music.
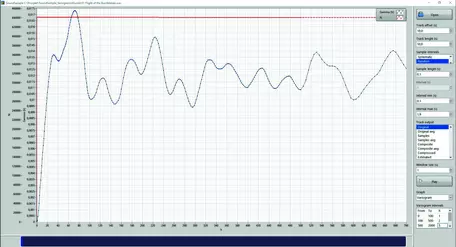
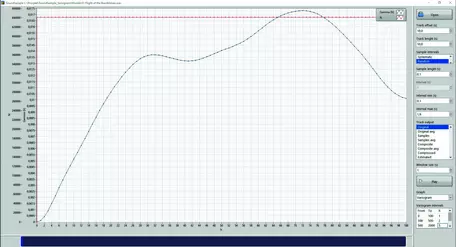
The variogram can be calculated and plotted over small and larger distances. Figure 5 and Figure 6 show the variograms of the "Flight of the Bumblebee" for long and short distances. In Figure 5 a cyclic structure can be seen. This could probably be identified as beats or rhythms, one of the dimensions in music. Such features can be found in geoscience as well. Figure 6 shows the same variogram focusing on shorter distances. The variogram shows a very continuous structure at very short distances. That indicates a very good spatial correlation and an increased likelihood of finding similar music/minerals close by. A coal deposit could show similar features.
There are several sampling strategies that can be followed when geological samples are collected. Basically, one can either sample systematic, random, or a combination. Figure 7 and Figure 8 illustrate these two sampling strategies applied to music.
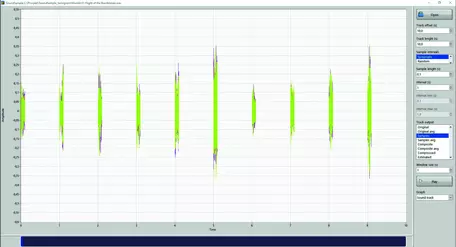
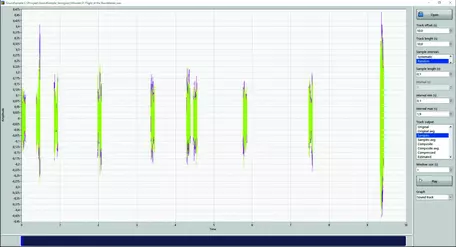
It is possible to play the samples and to hear what effect different sample densities and sample sizes have. In class, different sampling strategies are tested to determine what it takes for the students to recognize the song based on the sound of the samples. It is also possible to investigate the effect different sample strategies have on the variogram, its sill, range, and possibly nugget effect.
The music samples can be used to estimate and simulate the music. The estimate will potentially provide a best estimate while the simulation will provide one out of many possible realities given the samples. A simulation will, unlike the estimation, manage to recreate both the variogram and the histogram of the original data. The figure on page 11 shows a ten-second-long simulation of the song "Night Fever" by the Bee Gees. The simulation is far from the real thing. It is not possible to recognize the original song, neither by ear or eyes (looking at the wave graph). Within the framework of M3G, the students can hear how far from the regionalized variable we are when we simulate. Similarly, for the estimated version of the song.
The Future for M3G
The M3G concept allows for a conceptualization of fundamental aspects of geostatistics using music as a metaphor. The use of music triggers both the auditory and the visual systems. The idea and motivation is that this will increase the student's understanding of these fundamental aspects. The M3G concept has been tested in class both at Norwegian University of Science and Technology and at University of Queensland. Valuable and encouraging feedback from the students will motivate a continued development of this concept and teaching aids.
REFERENCES
Chilès, J. P., and Delfiner, P., 2012. Geostatistics: Modeling Spatial Uncertainty (Vol. 713): Hoboken, NJ, Wiley, 734 p.
Matheron, G., 1963, Principles of geostatistics: Economic Geology, v. 58 (8), p. 1246–1266, doi. org/10.2113/gsecongeo.58.8.1246.
McGurk, H., & MacDonald, J., 1976. Hearing lips and seeing voices. Nature, v. 264 (5588), p. 746–748. doi. org/10.1038/264746a0.
Comment? Start the discussion about Music as a Metaphor in Mining Geostatistics